An Astounding Comparison
If you read about my unsuccessful 1985 investment in 1943 Walking Liberty half dollars, you saw how much better it would have been had I purchased a much rarer and numismatically desirable 1921-D Walker. The $1150 spent for the 1921-D would today be a $4625(1) coin if I had based my decision on solid numismatic fundamentals. Rather, I purchased a generic date of poor promise that performed dismally.
But there is another crucial moral to the story…
If I had instead bought an S&P 500 IRA fund with dividend reinvesting, that same $1150 would be worth about $75,000 in 2024.(2) An astounding comparison! That's enough to stop a charging T-Rex in its tracks. Other stock index funds produced similar results.
Depressing as it is for this lost opportunity, at least that episode in life laid the groundwork for a valuable lesson.

My situation was/is very much representative of the average, middle-class individual. That’s why my advice is not to depend on rare coins as the primary strategy for saving up a large nest egg. There are preferential alternatives better suited for most smaller investors.
Let's compare the performance of several well-known investment types to that of three rare coin indexes, covering a 24-year time period from January 2000 to January 2024:
| Investment Type | Annualized Return 2000-2024 |
Description |
|---|---|---|
| Dow Jones | 7.57%* | The Dow is a stock market index consisting of 30 major publicly traded corporations, representing most sectors of the U.S. economy. First calculated in 1896, it is a benchmark investors watch to ascertain the overall direction of the stock market. |
| S&P 500 | 7.12%* | The S&P 500 is a stock market index tracking 500 large publicly traded corporations. It provides a measure of stock market strength and overall national economy. |
| Russell 2000 | 7.33%* | The Russell 2K index is comprised of 2000 smaller (but not tiny), widely diversified U.S. stocks. |
| Wilshire 5000 Total Market Index | 7.37%* | The Wilshire 5000 Index is the broadest barometer of publicly traded American corporations. It is seen as the best indicator of the overall U.S. equity market. |
| 10-Year Treasury Note | 3.12% | A 10-year Treasury note is a loan someone makes to the U.S. government. It pays a fixed interest rate to the lender every six months. Other T-notes mature in 2,3,5, and 7 years. Return shown is computed based on reinvesting the coupon payments. |
| AAA Corporate Bond | 4.32% | Corporations issue bonds to finance their activities. Investors buying corporate bonds in effect are lending money to the company and receive periodic interest payments until the bond matures. Bonds may be traded before maturity on the secondary market. |
| 6-Month CD | 1.60% | A Certificate of Deposit (CD) is an account offered by lending institutions that pay interest to a depositor for a committed time period. If $2500 were invested continuously in a 6-month non-jumbo CD from 2000 to 2024, ending balance would be $3663, with annualized return calculated at 1.60%. Historic CD APY rates used in this scenario obtained from FDIC. |
| American Gold Eagle | 8.10% | The American Gold Eagle is a U.S Mint coin made of 91.67% gold, available in four sizes. In Jan 2000, a $50 American Gold Eagle, containing one oz. pure gold, sold for $350. In Jan 2024, the same coin sold for $2150, computing to an annualized return of 7.86% (does not take into account selling at wholesale). |
| American Silver Eagle | 7.67% | The American Silver Eagle is a U.S. Mint coin made of 99.9% silver. Each coin contains one oz. pure silver. In Jan 2000, an American Silver Eagle sold for $7.50. In Jan 2024, the same coin sold for $41.00, computing to an annualized return of 7.33% (does not take into account selling at wholesale). |
| PCGS 3000 Index | 1.11% | The PCGS3000 Index reflects the opinions of PCGS’s coin experts, based on results from other indexes developed by PCGS for specific coin categories. The individual coins tracked in these other indexes are selected from a list of approx. 3000 collectible U.S. coins. Percent return here interpolated from PCGS chart for years 2000-2024. |
| PCGS Key Dates and Rarities Index | 4.85% | PCGS does not specify the coins tracked in their Key Dates and Rarities Index, but they are a subset taken from their compilation of approx. 3000 collectible U.S. coins . Percent return here interpolated from PCGS chart for years 2000-2024. |
| Collectors Rare Coin Index | 7.37% | The Collectors Rare Coin Index (CRCI) follows the percent change movements of 100 United States key date coins from Half Cents to Double Eagles. The purpose of the Index is to assess the overall direction and strength of the U.S. rare coin market over a period beginning in January 1990 to the current month. Percent return here calculated from cumulative value CRCI chart for years 2000-2024. |
| *Includes dividend reinvesting |
Next scheduled update for table above is January 2025.
In basketball, it’s easy to figure out who the best free throw shooter in the game is. Just look at the percentages.
The financial world is not as clear cut. Sure, the table above reports annualized returns for various investment types over the same 24-year period, but that alone does not make for a pure apples-to-apples comparison. Additional context is called for…
Stock Index funds
Let’s first examine the stock index funds. As a group, they have very good returns over the 24-year period. They're fairly volatile, with some really sour years, but with some utterly phenomenal intervals mixed in.
Many mutual funds and Exchange Traded Funds (ETFs) are structured to mirror the nature of these indexes, and can grow in tax-advantaged 401k and IRA plans. An ETF is a publicly traded fund that concentrates on an index, business sector, or commodity.
Stock index funds charge commissions and management fees that slightly moderate the returns.
If you have a longer time horizon and can tolerate risk, stock index funds hold the highest potential on this list. This is especially true if you have available a 401k with employer match: Take full advantage of that, making the maximum contribution allowable under the plan. For many Americans, this is a sweet recipe for creating personal wealth.

Treasury Notes
Treasury notes pay relatively small returns, but the earnings are exempt from state and local income taxes, so there’s that. Investors who prefer low risk ventures flock to T-notes, as they are touted as the most secure investment in the world.
Investors can hold notes until maturity or sell them on the secondary market. Some investment firms have created funds featuring T-notes of diverse maturities, but charge fees that mitigate returns a bit.

Corporate Bonds
A corporate bond is a debt issued by a company to generate cash for its business operation. Bond buyers are essentially lending money to the corporation and are paid interest periodically until the bond matures. There is a secondary market where bonds are traded before their maturity dates.
Corporate bonds pay the highest rate of any bond type, but with a bit more risk. Corporate bonds with AAA rating are judged as the least risky, but pay less interest than lower rated bonds.
For many investors, corporate bonds provide decent returns with acceptable risk. Bond mutual funds and ETFs feature a blend of bonds to diversify holdings, but siphon off a small percentage of the profits through commissions and annual management fees.
Certificate of Deposits
A Certificate of Deposit (CD) is a type of account offered by banks and credit unions that pay a specified interest rate on money you deposit with them for a fixed time period. CD terms may be a few months, one year, two years, or even up to ten years. The longer you commit your money to the lender, the higher APY (Annual Percentage Yield) earned.
Decades ago, when double-digit interest rates were the norm, CDs were attractive investments. Today, lenders generally offer them, but pay microscopic rates compared to the 1970s and 1980s. However, CDs are acceptable for many investors looking for somewhere to park their money safely. Just do a little internet research on CDs, and you'll see plenty of CD advertisements, so yes, they're still around.
Money market accounts (MMA) are similar to CDs. The main difference is that with MMAs, you can withdraw your money at any time without paying a penalty. The tradeoff for this flexibility is that MMAs pay a lower interest rate.

Precious Metals
Although gold and silver have been prized since the beginning of time, investing in them today is somewhat controversial.
On the “Pro” side, gold and silver help diversify an investor’s portfolio: Precious metals have often historically moved in the opposite direction of stocks and bonds. Another point is that during inflationary times, many believe gold and silver will provide a financial shelter. On top of that, precious metals are generally liquid with relatively small dealer margins.(3)
For “Cons”, a few financial experts say because the dollar hasn’t been backed by gold since 1971, investing in the yellow metal won’t help when a financial crisis hits or inflation heats up. Silver is no better. In the throes of a cataclysmic event, bartering will become the key to survival.(4) Perhaps in the aftermath of a nuclear holocaust, a bottle of water could be worth more than a solid gold brick, I suppose.
On balance, there appears to be more experts than not who say it’s okay to invest in precious metals, but no more than 10-15% of a portfolio should be committed to the shiny stuff.(5)
There are many common date collectible coins with 90% gold or silver content. In less than spectacular grades, the bulk of their value is tied to their intrinsic metal. A much smaller component of their value is derived from numismatic interest.
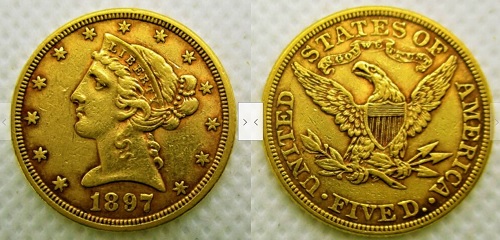
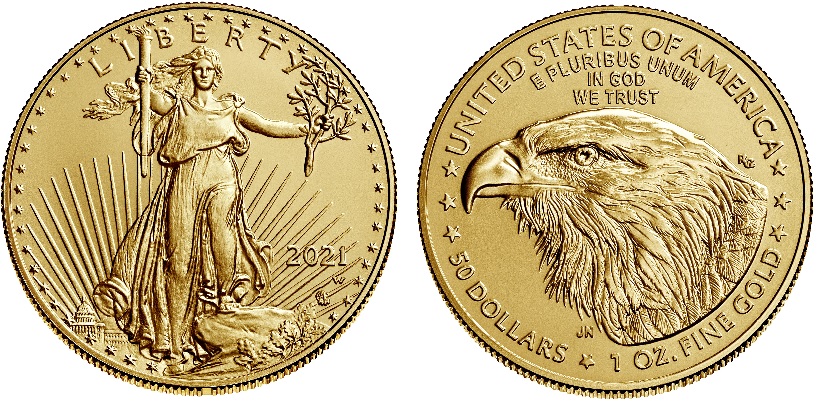
Investors with an eye toward precious metal holdings are better off buying non-numismatic bullion-based coins, such as the American Eagles struck by the U.S. Mint. These legal tender coins usually have lower buy-sell spreads than collectible coins and are generally easy to liquidate.
The American Eagles are technically coins, but the Mint program exists to appeal primarily to bullion investors (although a few of the American Eagles are “slabbed” as MS69 or MS70 grade by third-party services and carry some numismatic value).
In January 2000, a $50 American Gold Eagle coin containing one troy ounce of gold cost around $350. In 24 years, that same coin rose in value to about $2100. That’s an annualized appreciation rate of 7.86% (this computation would be less if selling at a wholesale price).
A $1 American Silver Eagle containing one troy ounce of silver spanning the same time frame of 24 years had starting and ending values of $7.50 and $41.00 respectively, for an annualized return of 7.33% (this computation would be less if selling at a wholesale price).

At first blush those numbers are quite attractive, but are diminished if you live somewhere where sales tax must be charged when buying bullion. If so, your cost to purchase precious metals is higher. The cost of storage and insurance further cuts into your potential profit percentage. Naturally, if wholesaled to a dealer at liquidation time, you’ll almost certainly sell for something less than the spot price.
None of the bullion-based coins can be purchased directly from the U.S. Mint. They are distributed to the public through a network of dealers.(8) For clarification, Proof coins and special mint-marked coins can be ordered from the Mint, but those are intended more for collectors, not bullion seekers.
In spite of the cost of buying, maintaining, and selling precious metals, if an individual investor decides to improve portfolio diversification, a small contingent of gold and silver bullion may be the answer.
One more thing about precious metals before moving on…
For investors desiring the benefits of owning precious metals without the cost and risk of taking physical possession, there are Exchange Traded Funds (ETFs). As mentioned above, an ETF is a publicly traded fund that concentrates on an index, business sector, or commodity. There are many ETFs that purchase precious metals on behalf of their shareholders. Shares of ETFs are bought and sold just as any other stock. With ETFs, investors can avoid the negatives of buying precious metals directly, but there are commissions and management fees to consider.
Rare Coins
Now we get to coins… how do we compare the performance of rare coins with that of more conventional investments? There are several coin indexes that may help.
PCGS3000
Professional Coin Grading Service (PCGS) has developed numerous indexes involving approximately 3000 collectible United States coins, most of them in higher grades. The indexes track performance as far back as 1970.
It’s somewhat of a mystery how these indexes are calculated, and which coins were chosen for specific indexes. The coin group selected for their flagship index, the PCGS3000, is based on opinions of their in-house experts, drawn from the performance of their other indexes, so there are multiple unknowns here.
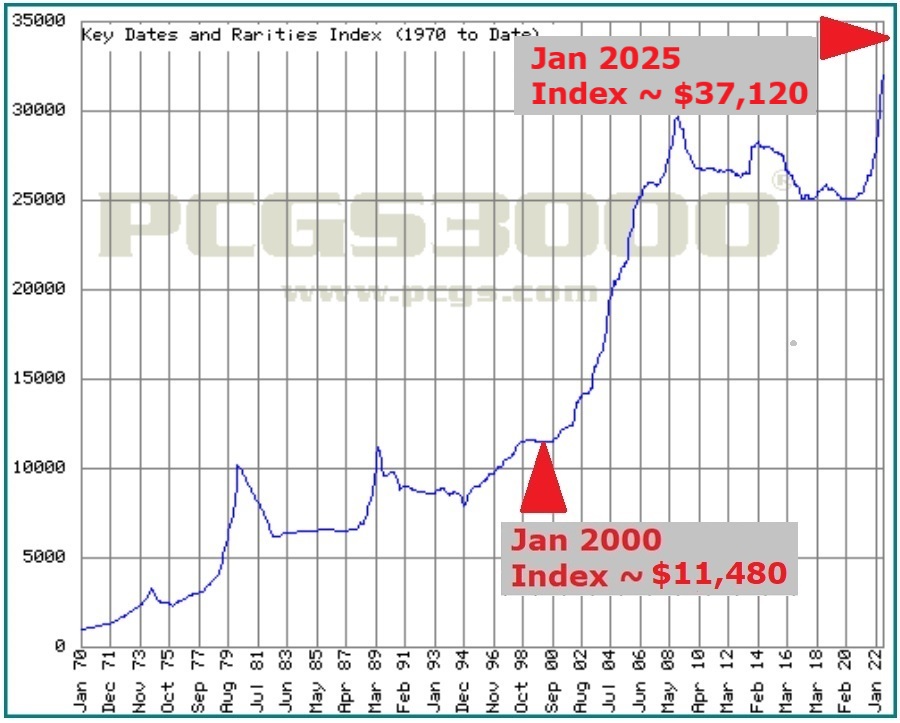
The units expressed on the vertical axis are dollars.
Interpolating from the PCGS3000 graph, this index moved higher at an annualized rate of just 1.11% over the 24-year period from January 2000 to January 2024. There are many generic, common date coins on the list. Although certainly collectible and a joy to own, generics possess little potential to advance significantly in value based solely on their numismatic DNA. It’s really not surprising to see such a dreary performance. Had it not been for the precious metal content of the gold and silver coins in the group, there would have been a loss.

PCGS Key Dates and Rarities Index
We can’t see the actual coins tracked in the PCGS Key Dates and Rarities Index, but judging by the name of the index, we assume venerable rarities like the 1877 Indian Head cent or the 1861-D Coronet half eagle make appearances there.
This index grew at an annualized rate of 4.85% over the same 24-year period from January 2000 to January 2024, as interpolated from the PCGS graph. This is much better than the PCGS3000. No doubt the index was buoyed by the presence of key date coins, with a lesser emphasis on generic coins.
Even though we do not know specifically the dates tracked, this index provides evidence that rare coins have the potential to generate returns on par with some conventional investment choices.
Collectors Rare Coin Index
The webmaster of Rare Coins 101 (Dan Goevert) is the creator of the Collectors Rare Coin Index (CRCI). The United States coins selected for tracking in the index have been traditionally popular with collectors for generations and represent some of the finest coins in U.S. numismatics.
There are 100 coins tracked in the CRCI, ranging from Half Cents to Double Eagles. Most of the tracked coins also appear in the Key Date List of Recommendations.
The goal of the CRCI is to estimate the direction and strength of the U.S. rare coin market and is updated monthly. Index movements are based on the averaged percent changes in dollar values for all 100 coins tracked.
Retail prices, needed for the percent change computations, were researched for the 100 coins back to January 1990. Thus, the CRCI baseline was set for January 1990 and assigned a score of 100.00 (indicating 100.00% of starting value).
Because the CRCI is driven by percentage movements (not dollars), we must extract retail pricing from the index's body of data to facilitate direct comparisons to all the computations above. For that reason, an associated chart tracking the cumulative retail value of the CRCI 100 coins was also developed.
Thank goodness for spreadsheets and charting software!
In the interests of consistency, the same 24-year time horizon, from January 2000 to January 2024, is highlighted.
In terms of dollars, the cumulative value of the 100 coins at the start of the 24-year period was around $850,000. That number ballooned to $4,683,110 by January 2024, translating to a compounded annualized growth rate of 7.37%.
Pretty darn respectable, right?

Yes, but unlike stocks, bonds, and many other investments, rare coin buyers must pay sales tax in many states and localities, so there’s an immediate hit to the bottom line because of the additional cost up front.
When the time arrives to sell, many collectors liquidate their coins through a dealer, and may settle for 20 to 40% less than retail. More on this in the Coin Investing in 2024 chapter. Shipping fees, if applicable, eat away at the margin too as do storage and insurance costs.
Now that 7.37% doesn’t look quite so good. When taking the front, middle, and back-end losses into consideration, a collector holding a “portfolio” modeled after the CRCI would have realized an annualized return of something closer to the 5.00% to 6.00% range.
Still, that’s a fairly respectable percentage, and is an indication that carefully chosen rare coins can indeed generate decent margins.

Obviously, there are many other types of investments we haven’t touched upon here. Real estate, cryptocurrencies, munis, short selling… the possibilities are seemingly endless (I was gonna mention pork belly futures, but that mystifying investment came to an end in 2011).
A competent financial adviser can help sort out the myriad of options and demonstrate the snowballing effect of smart long-term investing.
Here is the Rare Coins 101 Axiom from this chapter...
Developing a savings plan appropriately structured for your personal situation (time horizon, risk averseness, liquidity considerations, current net worth, etc.) should be the first priority for your investment dollars. For most people, that approach DOES NOT include rare coins initially.
However, this is not to say rare coins should never be part of an investment program.
Investors who have already put into action a savings plan appropriately structured for their personal situation may be wise to consider adding a few rare coins to their holdings.
We know there are some traditionally popular U.S. coins that increase in value at a pace to justify their purchase as an investment. The 1909-O Indian Head half eagle highlighted a few paragraphs above is one example. The recommendations in the Key Date Coin List are a good place to find more of those timeless rarities meeting this qualification.
Certain rare coins absolutely can outshine many bond funds or other types of conventional investments. Investors ready to move beyond their core strategies in search of higher potential returns and improved diversification should have a look at rare coins. On top of that, it’s much more interesting and enjoyable to own an artifact of history rather than a boring CD!
Now that we know it’s okay under some circumstances to consider rare, numismatically significant coins as in investment, in the next few chapters let’s review a few important things to remember before spending gobs of money on coins...
Quick Links to Other "Coin Investing" Chapters...
The next chapter in this section is Collect First, Invest Second.
Use the links directly below to navigate the "Rare Coins as an Investment?" section:
- An Astounding Comparison (the current chapter)
- Collect First, Invest Second
- Coin Investing in 2024
- Ready to Invest? Test Your Coin IQ First
All chapters referenced above are accessible from any other chapter in this section. Thus, no need to return to this Introductory page to link to other chapters.
Sources
1. Gibbs, William T., Managing Editor. Coin World Domestic Values. Sidney, OH. Amos Media Company. 2024.
3. Royal, James. "How to invest in gold: 5 ways to buy and sell it". Bankrate, 2021.
4. Ramsey, Dave. "Why Investing in Precious Metals Is a Bad Idea". Ramsey Solutions, 2021.
5. Rahal, Amine. "The Beginner's Guide To Investing In Precious Metals". Forbes, 2020.
6. 1897 Coronet Head Gold $5 Half Eagle. USA Coin Book.
7. Gibbs, Coin World Domestic Values.
8. Authorized Purchasers of United States Mint Bullion Coins.
